Topics Topics |
|
|
|
 Species Species |
|
|
|
|
|
Global economic benefits of GM crops reach almost $100 billion
Dorchester, United Kingdom
April 22, 2013
In the sixteenth year of widespread adoption, crop biotechnology has delivered an unparalleled level of farm income benefit to the farmers, as well as providing considerable environmental benefits to both farmers and citizens of countries where the technology is used
‘Where farmers have been given the choice of growing GM crops, adoption levels have typically been rapid. Why? The economic benefits farmers realize are clear and amounted to an average of over $130/hectare in 2011’ said Graham Brookes, director of PG Economics, co-author of the report. ‘The majority of these benefits continue to increasingly go to farmers in developing countries. The environment is also benefiting as farmers increasingly adopt conservation tillage practices, build their weed management practices around more benign herbicides and replace insecticide use with insect resistant GM crops. The reduction in pesticide spraying and the switch to no till cropping systems is continuing to reduce greenhouse gas emissions from agriculture’
Previewing the study, the key findings are:
- The net economic benefit at the farm level in 2011 was $19.8 billion, equal to an average increase in income of $133/hectare. For the 16 year period (1996-2011), the global farm income gain has been $98.2 billion;
- Of the total farm income benefit, 49% ($48 billion) has been due to yield gains resulting from lower pest and weed pressure and improved genetics, with the balance arising from reductions in the cost of production;
- The insect resistant (IR) technology used in cotton and corn has consistently delivered yield gains from reduced pest damage. The average yield gains over the 1996-2011 period across all users of this technology has been +10.1% for insect resistant corn and +15.8% for insect resistant cotton;
- A majority (51%) of the 2011 farm income gains went to farmers in developing countries, 90% of which are resource poor and small farms. Cumulatively (1996-2011), about 50% of the benefit each went to farmers in developing and developed countries;
- The cost farmers paid for accessing crop biotechnology in 2011 was equal to 21% of the total technology gains (a total of $24.2 billion inclusive of farm income gains ($19.8 billion) plus cost of the technology payable to the seed supply chain ($5.4 billion*/**);
- For farmers in developing countries the total cost of accessing the technology in 2011 was equal to 14% of total technology gains, whilst for farmers in developed countries the cost was 28% of the total technology gains. The higher share of total technology gains accounted for by farm income gains in developing countries relative to the farm income share in developed countries mainly reflects weaker provision and enforcement of intellectual property rights coupled with higher average levels of benefits in developing countries;
- Between 1996 and 2011, crop biotechnology was responsible for an additional 110 million tonnes of soybeans and 195 million tonnes of corn. The technology has also contributed an extra 15.8 million tonnes of cotton lint and 6.6 million tonnes of canola;
- If crop biotechnology had not been available to the (16.7 million) farmers using the technology in 2011, maintaining global production levels at the 2011 levels would have required additional plantings of 5.4 million ha of soybeans, 6.6 million ha of corn, 3.3 million ha of cotton and 0.2 million ha of canola. This total area requirement is equivalent to 9% of the arable land in the US, 25% of the arable land in Brazil or 28% of the cereal area in the EU (27);
- Crop biotechnology has contributed to significantly reducing the release of greenhouse gas emissions from agricultural practices. This results from less fuel use and additional soil carbon storage from reduced tillage with GM crops. In 2011, this was equivalent to removing 23 billion kg of carbon dioxide from the atmosphere or equal to removing 10.2 million cars from the road for one year;
- Crop biotechnology has reduced pesticide spraying (1996-2011) by 474 million kg (-9%). This is equal to the total amount of pesticide active ingredient applied to arable crops in the EU 27 for one and three-quarter crop years. As a result, this has decreased the environmental impact associated with herbicide and insecticide use on the area planted to biotech crops by 18.1%***;
- The environmental gains from the GM IR traits have mostly derived from decreased use of insecticides, whilst the gains from GM HT traits have come from a combination of use of more environmentally benign products and facilitation of changes in farming systems away from conventional to reduced and no tillage production systems in both North and South America. This change in production system has reduced levels of GHG emissions from reduced tractor fuel use and additional soil carbon storage.
For additional information, contact Graham Brookes Tel +44(0) 1531 650123. www.pgeconomics.co.uk
Report available to download at www.pgeconomics.co.uk. Also contents available as two papers (with open access), separately, covering economic and environmental impacts, in the peer review journal GM Crops at www.landesbioscience.com/journal/gmcrops. GM Crops 4:1, p 1-10 Jan-March 2013 (economic impact paper) and vol 4.2, 1-11, April-June 2013 forthcoming for environmental impact paper
* The cost of the technology accrues to the seed supply chain including sellers of seed to farmers, seed multipliers, plant breeders, distributors and the GM technology providers
** A typical ‘equivalent’ cost of technology share for non GM forms of production (eg, for new seed or forms of crop protection) is 30%-40%
*** As measured by the Environmental Impact Quotient (EIQ) indicator (developed at Cornell University)
More news from: PG Economics Ltd.
Website: http://www.pgeconomics.co.uk Published: April 22, 2013 |
|
|
|
Better Food Venture's
AgTech Landscape 2019

|
| |
|
2019 THRIVE Top 50
landscape map

|
| |
|
Concentration in Seed Markets - Potential Effects and Policy Responses
(OECD December 2018)
|
|
Visualizing Consolidation
in the Global Seed Industry
1996–2018
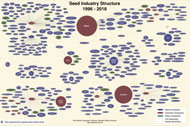
Seed Industry Structure
1996-2018
Phil Howard
Associate Professor
Michigan State University
|
|
2017 Seed Company Family Tree
Ccreated Septebmer 2017
by Robert Walsh
WaSoo Farm, Elk Point, South Dakota |
 |
Syngenta Brands Family Tree
Ccreated January 2017 by Robert Walsh, WaSoo Farm, Elk Point, South Dakota
|
 |
| |
Rabobank's
World Vegetable Map 2018 |
 |
|
|