Topics Topics |
|
|
|
 Species Species |
|
|
|
|
|
FAO Statistical Yearbook paints a big and detailed picture of food and agriculture - Updated edition of data compendium sheds new light on greenhouse gas emissions from food production
Rome, Italy
19 June 2013
The 2013 edition of FAO's Statistical Yearbook released today sheds new light on agriculture's contribution to global warming, trends in hunger and malnutrition and the state of the natural resource base upon which world food production depends.
Greenhouse gas emissions from agriculture grew 1.6 percent per year during the decade after the year 2000, new FAO data presented in the yearbook show, with the sector's total annual output in 2010 reaching 5 billion tons of carbon dioxide equivalents (CO2 eq, a measure used to compare and aggregate different greenhouse gases). This equals 10 percent of all anthropogenic greenhouse gas emissions.
Among the various agriculture sectors, livestock activities and the use of synthetic fertilizer are the largest contributors. This does not include emissions caused by land use change and wild fires.
Issued annually, FAO's Statistical Yearbook is an authoritative compendium of data on the major trends shaping global food and agriculture today. For each thematic area, brief analyses of the main trends are paired with graphical data visualizations as well as tables with key indicators.
The topics it covers include: capital and investment; climate change; food availability; food production and trade; food prices; hunger and malnutrition; the consequences of political instability and natural- and human-induced disasters on food security; the state of the agricultural resource base and sustainability and environmental impacts.
Key facts and figures
Hunger and malnutrition
- Almost 870 million people, or 12.5 percent of the world's population, were undernourished in 2010-2012; the vast majority of them (852 million) live in developing countries.
- Between 2005 and 2011, one out of four African countries reported a stunting rate of at least 40 percent. Stunting rates also exceeded 40 percent in South and South East Asia during the same period, with peaks in India, the Lao People's Democratic Republic, Nepal and Timor-Leste.
- African countries show the highest rates of underweight prevalence. During 2005-¬2011, 16 African countries showed underweight rates of at least 20 percent, with the highest levels recorded in the Horn of Africa.
Food production and supply
- Global crop production has expanded threefold over the past 50 years, largely through higher yields per unit of land and crop intensification.
- Global per capita food supply rose from about 2 200 kcal/day in the early 1960s to over 2 800 kcal/day by 2009. At 3 370 kcal/person/day, Europe currently has the highest average per capita food supply.
- Cereals occupy more than half of the world's harvested area and are the most important food source for human consumption. Of the 2.3 billion tonnes of cereals produced each year, 1 billion are destined for human consumption, 750 million tonnes are used as animal feed and 500 million tonnes are either processed by industry, used as seed, or wasted.
Economic trends
- Following a decade of slower growth in the 1990s, global public spending on agricultural R&D increased steadily from $26.1 billion in 2000 to $31.7 billion in 2008. Most of this increase was driven by developing countries. China and India accounted for close to half of this growth, but other countries - particularly Argentina, Brazil, Iran, Nigeria and the Russian Federation - also significantly increased their spending on public agricultural R&D. Still, these trends mask the negative developments that have taken place in numerous smaller, poorer and less technologically advanced countries.
- Buoyed by high commodity prices, agriculture has demonstrated astonishing resilience during global economic turmoil. In 2010, agricultural value-added at the world level rose by 4 percent, in contrast to a 1 percent increase in overall GDP.
The new edition of the Statistical Yearbook was released today during the regular meeting of FAO's governing conference (15-22 June).
More news from: FAO (Food and Agriculture Organization)
Website: http://www.fao.org Published: June 19, 2013 |
|
|
|
Better Food Venture's
AgTech Landscape 2019

|
| |
|
2019 THRIVE Top 50
landscape map

|
| |
|
Concentration in Seed Markets - Potential Effects and Policy Responses
(OECD December 2018)
|
|
Visualizing Consolidation
in the Global Seed Industry
1996–2018
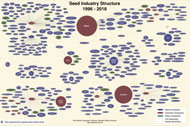
Seed Industry Structure
1996-2018
Phil Howard
Associate Professor
Michigan State University
|
|
2017 Seed Company Family Tree
Ccreated Septebmer 2017
by Robert Walsh
WaSoo Farm, Elk Point, South Dakota |
 |
Syngenta Brands Family Tree
Ccreated January 2017 by Robert Walsh, WaSoo Farm, Elk Point, South Dakota
|
 |
| |
Rabobank's
World Vegetable Map 2018 |
 |
|
|