USA
December 6, 2022
Highlights:
-
China’s cotton production has become concentrated in its remote Xinjiang region in recent years, while farmers in the rest of the country have largely abandoned the crop.
-
Chinese textile manufacturers now mainly use cotton from Xinjiang—more than 2,000 miles away from most textile mills—because their access to imported cotton is limited by a quota.
-
While China’s textile manufacturers appear to be eager to import cotton, China’s role as a market for U.S. cotton is diminishing and other countries are taking its place. In 2021, Vietnam, Pakistan, Indonesia, Bangladesh, and Turkey imported 25.4 million bales of U.S. cotton, and China imported 9.5 million bales.
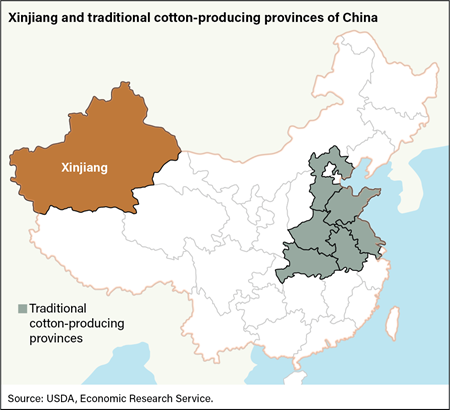
China has been a central player in global markets for cotton and textiles since the early 2000s, but trade patterns established decades ago are being disrupted by the changing economics of cotton production and textile manufacturing in that country. One of the factors shaking up the industry is that Chinese officials have been shifting the country’s cotton production to the remote Xinjiang Uyghur Autonomous Region. Known simply as “Xinjiang,” this provincial region in northwest China borders several Central and South Asian countries and contains a large population of Uyghurs and other minority ethnic groups.
Traditionally, China’s textile manufacturing and cotton production were both concentrated in provinces along its coast and in river valleys that had easy access to local cotton supplies, urban markets, and ports. However, with 90 percent of China’s cotton now grown in Xinjiang, the longer physical distance between where cotton is produced and where it is used has created supply difficulties for China’s textile industry. Additional challenges have come from import bans imposed by the United States and other countries on cotton products produced with forced labor in Xinjiang. Cumulatively, these changes are reshaping the global market for cotton.
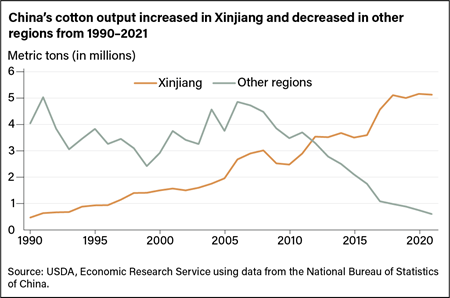
China first set up military-run farms to grow cotton in Xinjiang in the 1950s. Expansion accelerated during the 1990s, in part because the region was free of the pests that damaged the crop in the traditional growing regions in eastern and central China. In the early 2000s with the introduction of pest-resistant varieties, China’s overall cotton production boomed throughout the country. Production in the traditional regions peaked at nearly 5 million metric tons in 2006. At that point Xinjiang’s production was under 3 million metric tons. More recently, production in the traditional cotton regions has plummeted, falling to 602,000 metric tons in 2021. At the same time, Xinjiang’s output has grown to around 5 million metric tons.
Download larger size chart (1025 pixels by 934, 72 dpi)
Rising labor costs, small and fragmented plots that present a barrier to mechanization, and inducements by Chinese authorities to plant other crops such as grains and oilseeds have contributed to the production declines in the traditional cotton regions. In contrast, growth in Xinjiang has been bolstered by reduced competition for land from alternative crops, lower pest pressure, and fewer off-farm opportunities than in the traditional regions. The region’s large-scale, military-run farms also are more amenable to mechanization, and Chinese officials have increasingly promoted Xinjiang’s cotton and textile industries.
Download larger size chart (1025 pixels by 679, 72 dpi)
During 2020–2021, the U.S. Customs and Border Protection (CBP) agency barred U.S. imports of cotton and cotton products from entities in Xinjiang that used forced labor. In June 2022, a broader U.S. embargo on cotton produced in Xinjiang and products manufactured from such cotton took effect under the Uyghur Forced Labor Prevention Act. About 90 percent of China’s cotton is now produced in Xinjiang, and only about 20 percent of the cotton used by Chinese textile manufacturers is imported. That means most Chinese cotton products contain cotton that was produced in Xinjiang and are thus subject to the ban.
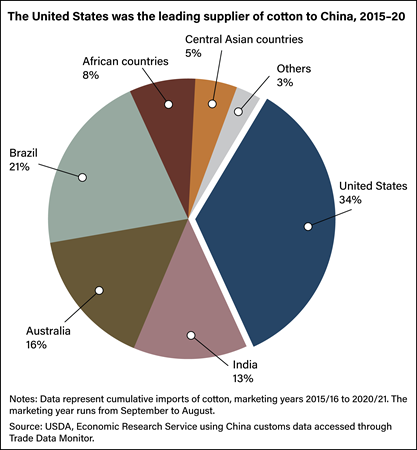
Even though most of China’s cotton is now produced in Xinjiang, the country’s textile manufacturers are still mainly based more than 2,000 miles away in the traditional cotton-producing regions. Although a Chinese Government subsidy for transporting cotton from Xinjiang to the central and eastern regions reduces the cost of using Xinjiang-produced cotton, some textile manufacturers have opened branches in Xinjiang. However, textile manufacturers remain concentrated in the traditional regions, in part, because of their preference for imported cotton, which largely arrives through ports along China’s eastern coast. From 2015 to 2020, the United States supplied more than one third of China’s cotton imports. China also imported cotton from Brazil, India, Australia, about 25 African countries, and 4 Central Asian countries.
Download higher resolution chart (4267 pixels by 4603, 300 dpi)
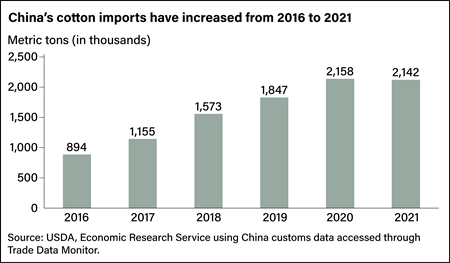
China’s Government limits imports of cotton through a tariff-rate quota system, which drives textile manufacturers to primarily use Xinjiang cotton. China adopted the quota system when it joined the World Trade Organization in 2001. This system allows China to import 894,000 metric tons of its total cotton requirements at a 1-percent tariff each year. When the import quota was established in 2001, this volume represented nearly 20 percent of the total cotton used by Chinese manufacturers. After two decades of industry growth, the same volume accounts for about 10 percent of the industry’s needs. Chinese manufacturers that are allocated a share of the quota can import a specified volume of cotton under the 1-percent tariff rate. Cotton imported outside the quota faces up to a 40-percent tariff, which is not economical for textile manufacturers, so being able to import under the quota is valuable.
To accommodate the growing textile industry and its increased demand for imported cotton, Chinese authorities in recent years have supplemented the tariff-rate quota with an additional “sliding-scale” quota. This system has helped increase the total share of imported cotton to about 20 percent. The exact rate for the sliding-scale tariff is set by authorities each year at a level between 5 percent and 40 percent, based on market conditions. Hundreds of companies apply for a share of both quotas each year.
In 2016, Chinese authorities began a campaign to sell excess reserves of cotton, and so no sliding-scale quota was issued. China’s cotton imports were at or above the 894,000 metric tons set in the tariff-rate quota. From 2017 onward, though, the volume of imports began to grow again as the sliding-scale quota was again issued. By 2020, Chinese officials announced they had completed their years-long disposal of excess reserves and imports increased further. In 2021 though, imports dipped again during the Coronavirus (COVID-19) pandemic.
Download higher resolution chart (4267 pixels by 2500, 300 dpi)
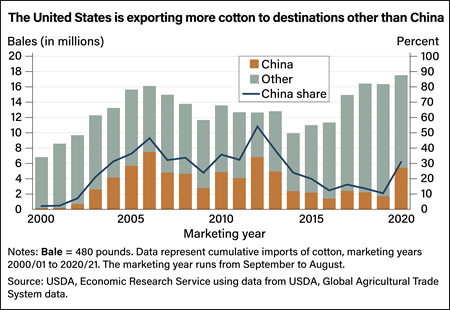
Even with increased demand for imported cotton among China’s textile manufacturers, the Chinese market for U.S. cotton diminished. In 2012, the share of U.S. cotton exports going to China peaked at more than 54 percent and has fallen since then. In 2019, after China imposed retaliatory tariffs on U.S. goods because of trade actions the United States had taken, the share of U.S. cotton exported to China fell to less than 11 percent. The share of U.S. cotton exports going to China rebounded to 30 percent in 2020, after the United States and China signed the “Phase One” trade agreement in which China agreed to boost its imports of U.S. agricultural products. Currently, China remains the largest single cotton-importing country by volume, but the combined imports of its competitors now exceed the amount of cotton China brings in.
Part of this shift can be tied to the fact that a growing volume of U.S. cotton is exported to countries like Vietnam, Pakistan, Bangladesh, Indonesia, Mexico, Thailand, and South Korea, manufactured into yarn, and then re-exported as yarn to Chinese textile manufacturers. In 2020, U.S. exports to these countries accounted for 69 percent of total U.S. cotton exports. Because China has no quota on cotton yarn imports, this cotton yarn trade route gives textile manufacturers a way to avoid import quotas on raw cotton. In recent years, China’s imports of cotton yarn were as large as its imports of raw cotton. An increase in the use of imported yarn made from cotton that originates in the United States, India, and other countries dilutes the share of Xinjiang cotton in textiles manufactured in China. Increasing the share of imported cotton and cotton yarn in textiles and apparel makes it easier for manufacturers in China to comply with international bans on the use of cotton produced in the Xinjiang region.
Download higher resolution chart (4267 pixels by 2945, 300 dpi)
Overall, exports of U.S. cotton remain strong, as sales to other destinations, primarily in Asia, have surged to record levels—more than 16 million bales during 2018–19. In 2021, Vietnam, Pakistan, Indonesia, Bangladesh, and Turkey imported 25.4 million bales of U.S. cotton while China imported 9.5 million bales. Moreover, exports to these other countries have been far less volatile than exports to China. China is expected to remain a major market for U.S. cotton exports, but the share of U.S. exports to China is forecast to fall while the share to other Asian countries is expected to grow.
This article is drawn from...
Chinese Cotton: Textiles, Imports, and Xinjiang, by Fred Gale and Eric Davis, ERS, August 2022